# Bandwidth Watcher
# Overview
Take advantage of the capabilities of Bandwidth Watcher, a unique and innovative bandwidth usage monitoring tool engineered by CloudOptimo. Our tool effortlessly allows you to monitor bandwidth usage network traffic and track the costs associated with network traffic and bandwidth usage over network interfaces within VPC. User-friendly dashboards in Bandwidth Watcher give detailed insights into bandwidth and network traffic for you to optimize your cloud resources and reduce costs on bandwidth usage.
# Prerequisite
Before using our Bandwidth Watcher tool, it is crucial to configure VPC flow logs. Bandwidth Watcher allows users to set up VPC Flow logs for network interfaces within VPC using a few straightforward steps.
# Steps to Enable VPC Flow Logs
To enable VPC flow logs, begin this by setting up the S3 bucket in AWS. Bandwidth Watcher provides a simple user interface to streamline the process of S3 bucket creation to store VPC flow logs in two easy steps.
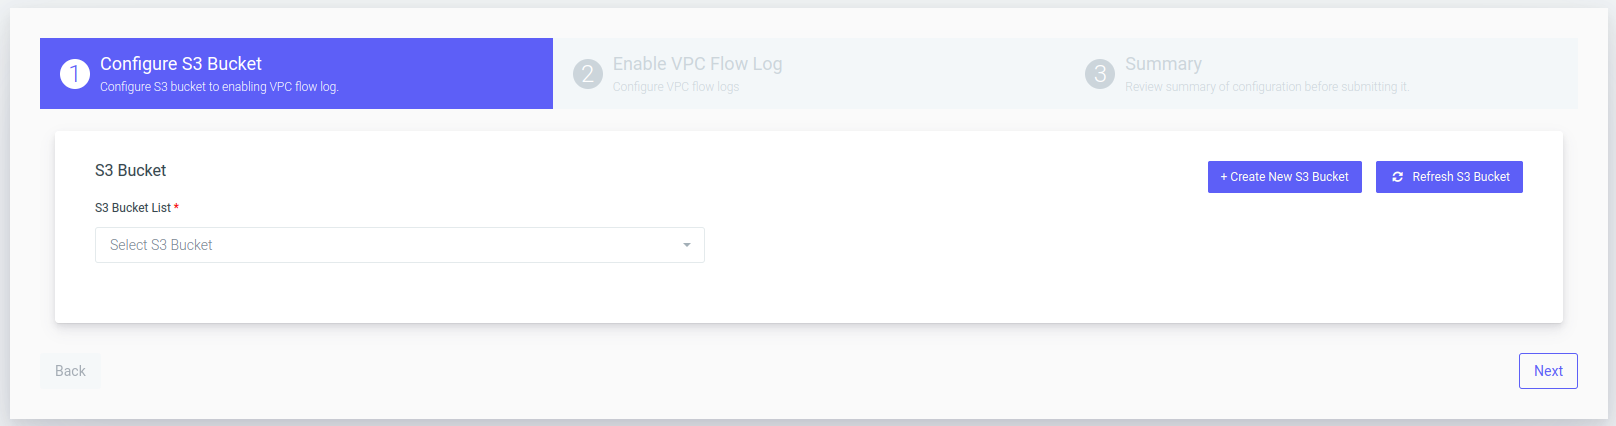
# 1. Configure S3 Bucket
Click on Create New S3 Bucket if you don't have your bucket name present in the S3 Bucket list drop-down menu.
From the “Region Name” drop-down menu, select the name of the region and enter the new Bucket Name.
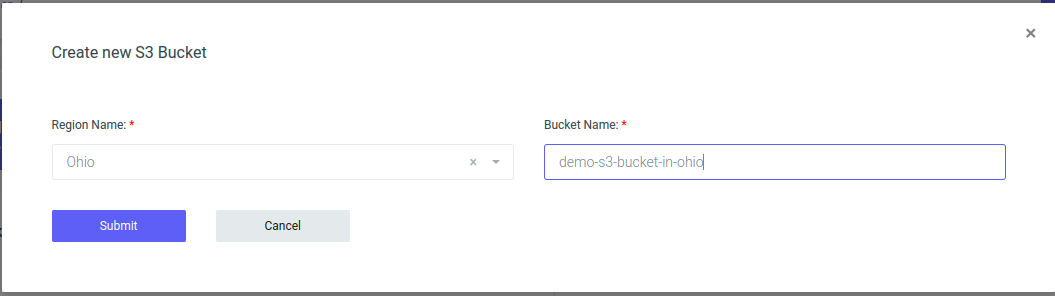
After creating the S3 Bucket in Bandwidth Watcher, click the “Next” button. It’s time to set up VPC Flow logs in Bandwidth Watcher to retrieve information on Bandwidth Usage and cost.
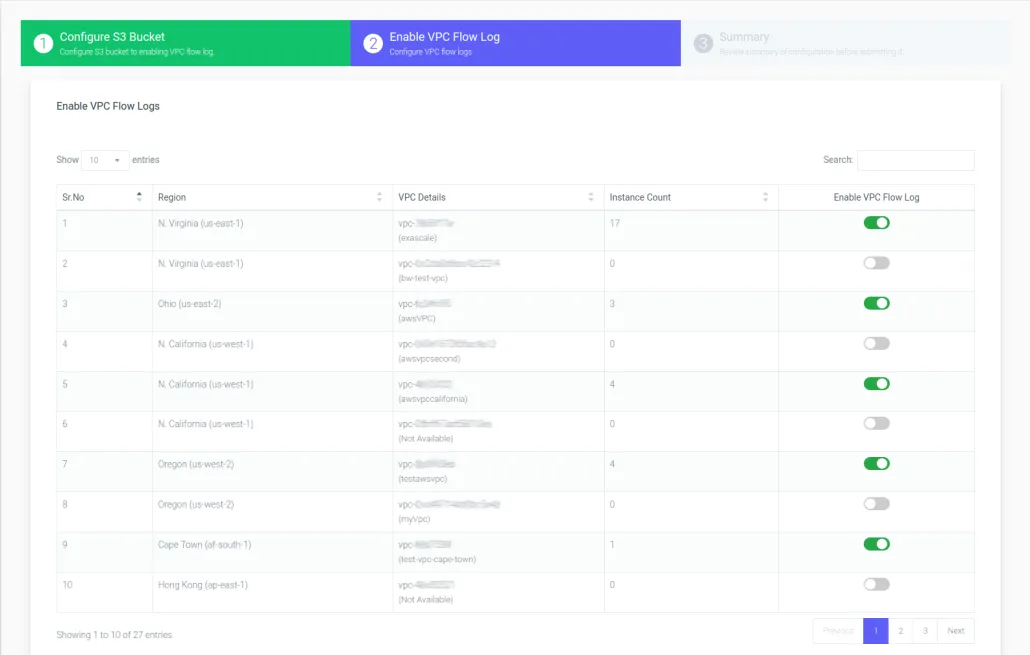
# 2. Configure VPC Flow logs
In the next window, simply toggle the “Enable VPC Flow log” switch button for your chosen VPC and Region and click “Next.”
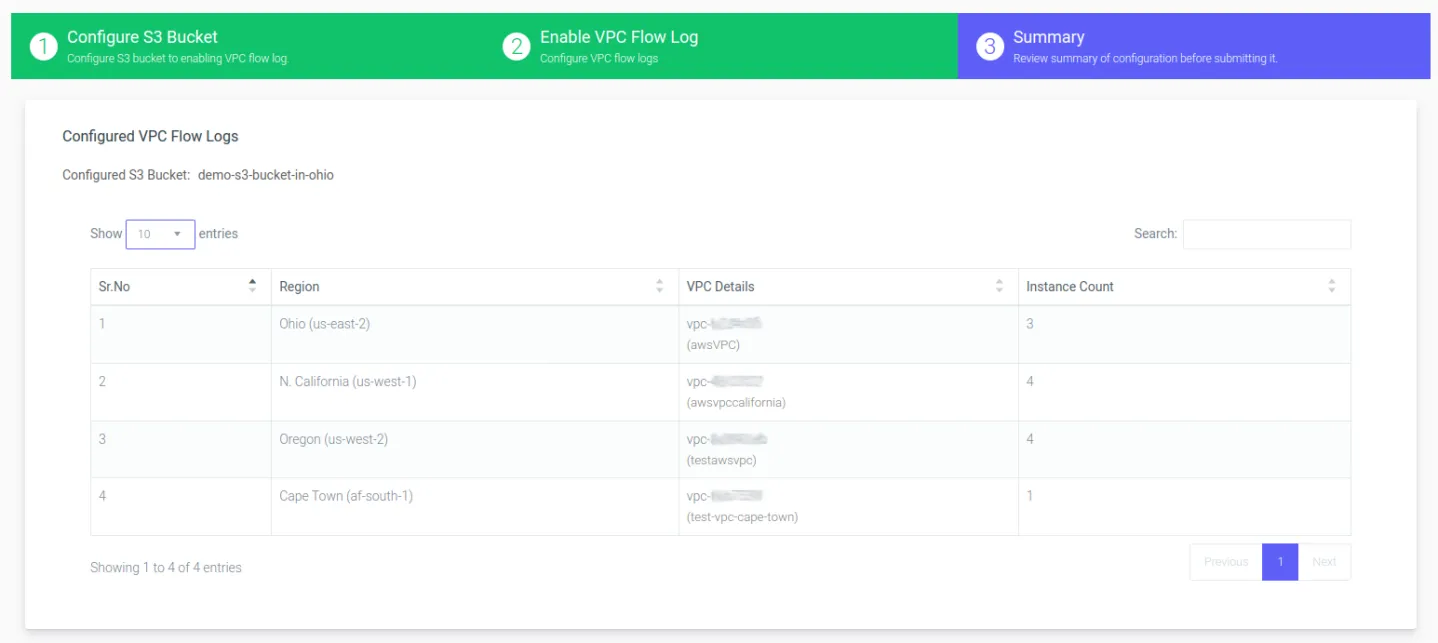
# 3. View configuration summary
After selecting the toggle switch to Enable the VPC Flow log for the desired regions and instances, the Bandwidth watcher will redirect you to the summary page. Review and confirm that Region and VPC details match the VPC for which you want to enable the VPC flow log. Click on the “Finish” button after you have confirmed the details.
You will see a message flashing on your screen reading “Successful.”
Congratulations! You have successfully managed to configure and enable your VPC flow logs. You are ready to examine the Bandwith Watcher tool and its features.
# 4. Bandwidth Watcher Dashboard
Start Exploring the bandwidth watcher dashboard to view your bandwidth usage.
After launching Bandwidth Watcher, you can see a dashboard like the one below. The following dashboard represents bandwidth cost by date and bandwidth usage by date.
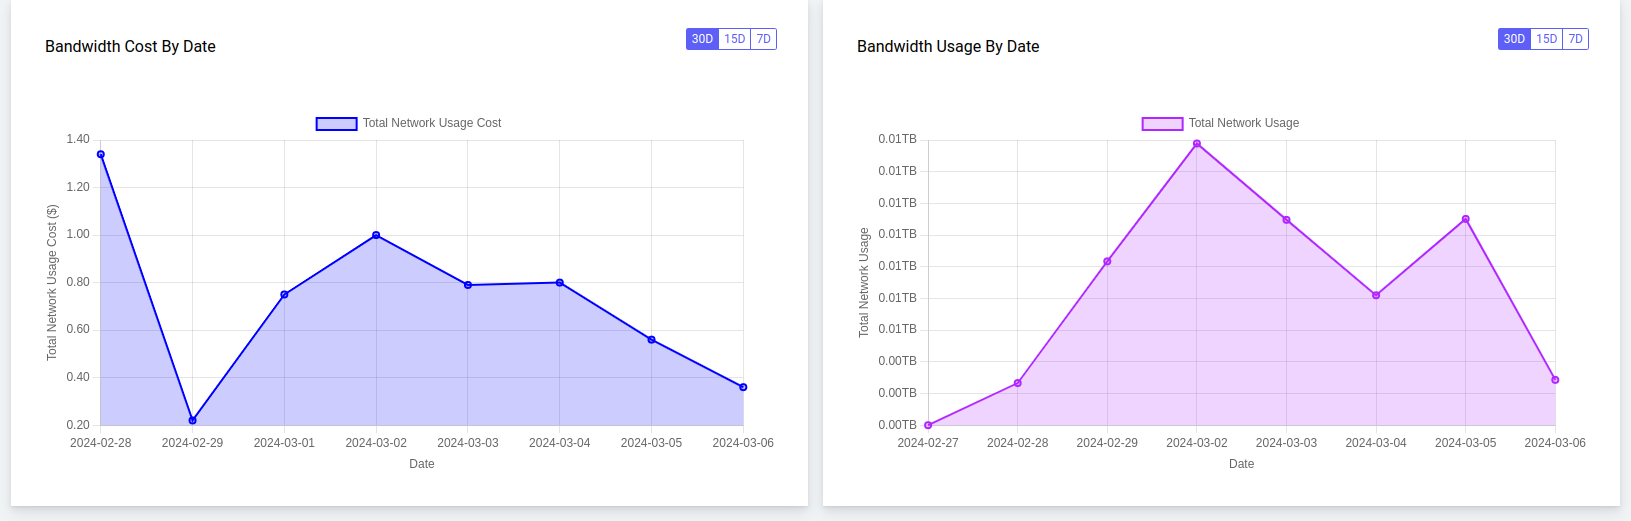
Important Note: Bandwidth Watcher usually takes at least 24 hours to collect the data related to bandwidth usage and network traffic.